← All case studiesMeasure the production day
Solution concept / Custom OEE & production intelligence
Measure the production day
the way it actually works.
A fit-for-purpose OEE system for a high-mix automated line where product rates, planned changeovers, short stops, material waits, quality holds and incident response could not be represented honestly by a generic package.
Explore the operating modelWhy custom OEE
The formula was standard. The definitions around it were not.
The line produced multiple product formats with different target speeds. Planned changeovers, laboratory release, material shortages and micro-stops all affected output differently. A boxed OEE product could calculate a percentage, but it could not explain the plant’s real losses without extensive unused modules and costly customisation.
Plant-specific operating model
One score — with every component traceable to real production evidence.
Availability
Approved non-production windows are separated from scheduled production. Unplanned stops, material waits and unresolved states remain visible instead of disappearing into one downtime bucket.
Performance
The target rate follows the active product recipe. A high-mix line is not compared against one unrealistic nameplate speed.
Quality
First-pass good output, rework, scrap and laboratory holds remain distinct so the score does not hide where quality cost appears.
Screen 01 / Shift dashboard
The current result and its explanation on one screen.
CF ClariFabLINE 04 · SHIFT A · 06:00–14:00LIVE
060708091011
- Material wait38 min
- Micro-stops27 min
- Changeover overrun19 min
- Quality hold14 min
RUNCHANGEOVERRUNSTOPRATE LOSSRUN
Screen 02 / Cycle analytics
Total cycle time was decomposed into the phases engineers could change.
CF ClariFabCYCLE ANALYTICS · PRODUCT P-184LAST 50 CYCLES
HOLD PHASE DRIFT
LOADBUILDHOLDRELEASE
Load0.82 s+0.03
Build1.36 s+0.02
Hold1.71 s+0.24
Release0.92 s0.00
Screen 03 / Error and event log
Machine events became an operational record — not an unreadable alarm history.
CF ClariFabEVENT LOG · LINE 04 · SHIFT A146 EVENTS
All statesProduction impactReason requiredUnclassified: 3
STARTDURATIONSOURCEEVENTPRODUCTION REASONOWNER / STATE
10:42:1812:48PLC · E-Stop 02Safety circuit openMechanical jam at transferMaintenance · Active
09:27:0403:16Sensor S-14No product detectedMaterial starvationOperations · Closed
08:51:3300:42Encoder ENC-04Speed below recipeMicro-stop / recoveryAutomatic · Closed
08:14:0918:54OperatorChangeover completeChangeover over standardShift lead · Reviewed
07:46:2206:31QualityOutput placed on holdLaboratory release waitQuality · Closed
Control alarms remain intact.The OEE layer adds production meaning, ownership and resolution context.
Screen 04 / Incident handling
A significant stop followed a visible workflow until the learning was captured.
CF ClariFabINCIDENT INC-2028 · TRANSFER JAMPRIORITY HIGH
PRODUCTION IMPACT12 min 48 sEstimated 214 units not produced
RECURRING PATTERN3 events / 7 daysSame station and product family
CURRENT OWNERMaintenanceAction due before next shift
Encoder speed loss 1.8 s before stop · sensor S-14 remained occupied · image frame attached.
Inspection interval added at 40 operating hours. Recurrence monitor active for the next seven shifts.
KPIs people could act on
OEE remained the summary. The supporting KPIs drove the work.
Plan attainment
Good output against the production plan by shift, product and order.
Net productive time
Time when the line produced acceptable output at a useful rate.
Micro-stop burden
Count and total duration of short interruptions normally lost in PLC history.
Changeover variance
Actual changeover time against the standard for the specific product transition.
MTBF & MTTR
Failure frequency and recovery time by station, event family and production context.
Unclassified loss
The share of lost time that still lacks a trusted operational reason.
First-pass yield
Good output before rework, with scrap and quality holds kept separate.
Incident response
Time to acknowledge, assign, correct and verify significant production events.
Business value
The system reduced argument about the number and increased action on the loss.
One trusted loss model
Operations, maintenance, quality and management worked from the same definitions and supporting evidence.
Faster stop response
Significant events had visible impact, ownership and escalation instead of waiting for an end-of-shift report.
Targeted engineering work
Recurring losses could be prioritised by production impact, product context and cycle evidence.
Less manual reporting
Shift results, reason codes, cycle data and incident status no longer required repeated spreadsheet reconciliation.
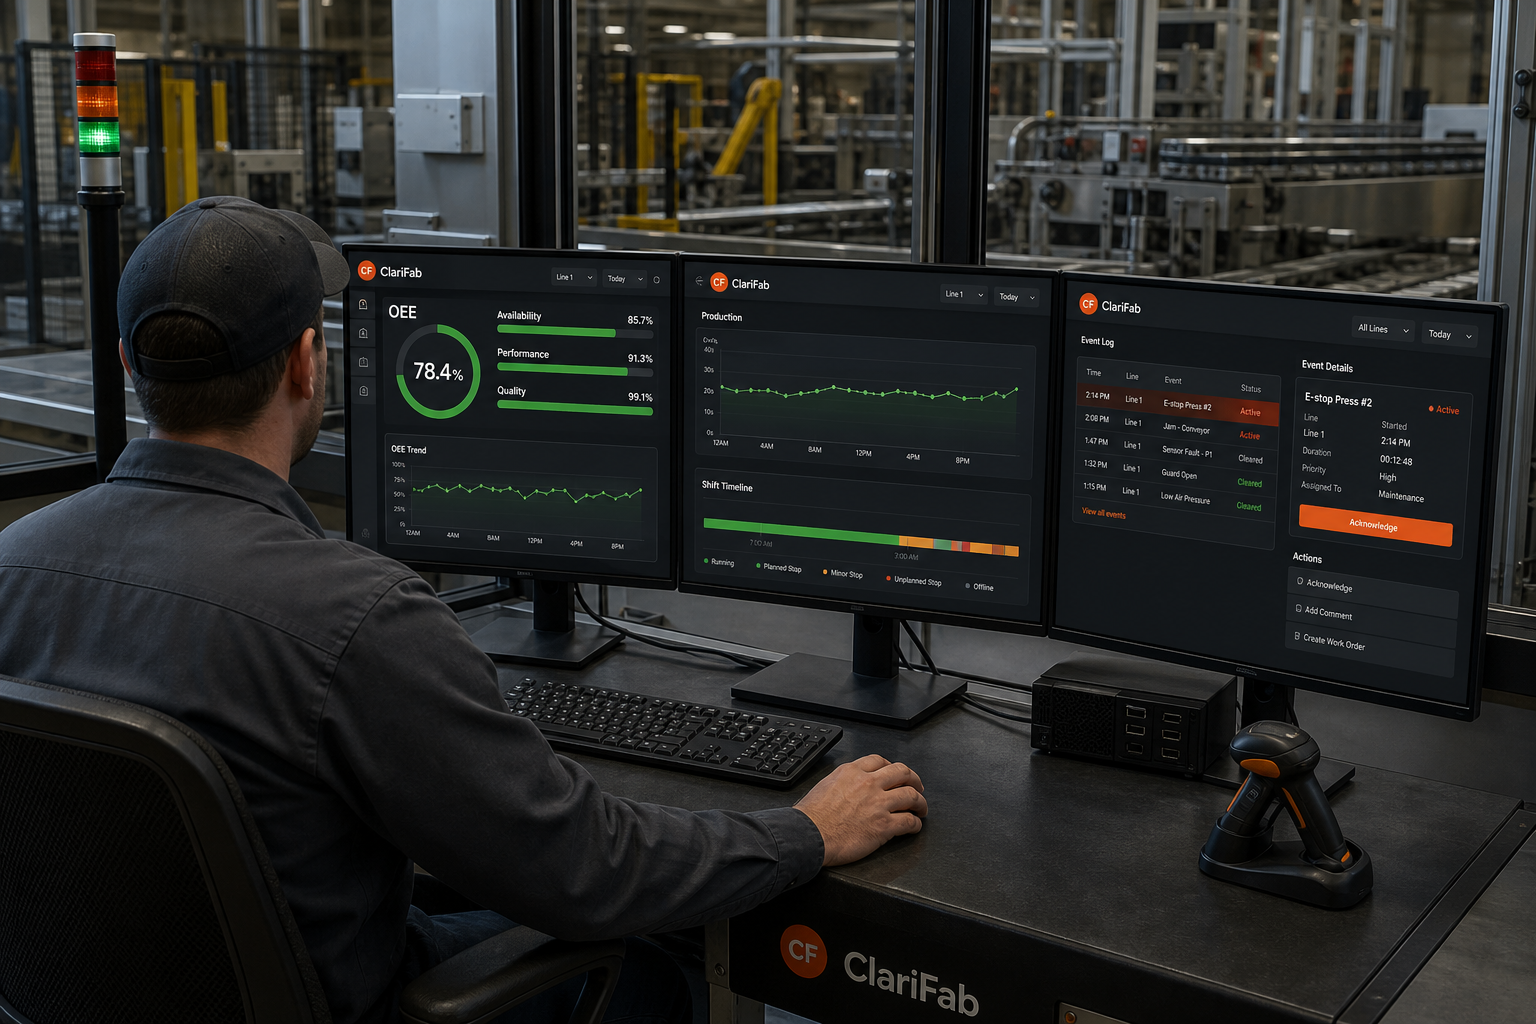
CONCEPTUAL OPERATOR WORKSTATIONInformation where decisions happen
Operators saw the current shift. Engineers could open the evidence behind it.
The same production context supported different roles without forcing every user into the same screen: a concise live view for operators, incident ownership for supervisors and deeper cycle and loss analysis for engineering.
Fit-for-purpose information layer
The existing line supplied events. The new system supplied operational meaning.
Machine states, independent signals, product recipes, shift context, quality results and human reason codes were aligned in time and stored as one traceable production record.
CUSTOM OEE · KPI MODEL · CYCLE ANALYTICS · EVENT LOG · INCIDENT WORKFLOW · ROLE-BASED DASHBOARDS
Concept note
This page describes a representative solution concept. The production scenario, interface values, targets, event names and incident records are illustrative; a real OEE model would be defined and validated with the plant’s operations, maintenance, quality and management teams.
Start with one disputed number
Which production loss does your current OEE fail to explain?
ClariFab can define the minimum signal set, plant-specific loss model and useful screens for a focused OEE pilot.
Discuss a custom OEE pilot